How to Read Forex Charts: Beginner Candlestick Guide
If you want to track the trends, identify entry points, and understand market sentiment, you need to learn how to read price charts. While there are line charts and bar charts, the absolute industry standard used by professional traders worldwide is the Japanese Candlestick Chart.
Candlesticks give you a wealth of visual information at a single glance. Here is your quick blueprint to understanding exactly what candlesticks are telling you.
The Anatomy of a Candlestick
A single candlestick represents price movement over a specific time frame (for example, 15 minutes, 1 hour, or 1 day). Each candle consists of a Body and Wicks (also known as shadows).
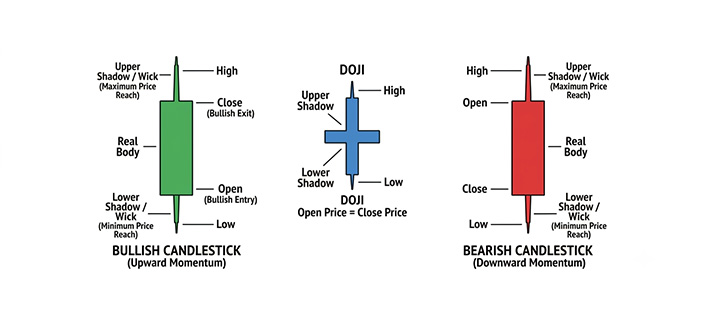
Every single candle tracks four critical price points during its specific timeframe:
- Open: The price the currency pair started at when the candle timer began.
- Close: The final price when the candle timer ended.
- High: The absolute highest price point buyers managed to push the market to during that timeframe.
- Low: The absolute lowest price point sellers managed to drop the market to.
Bullish vs. Bearish Candlesticks
Your charting software will typically color-code these candles so you can instantly feel the momentum of the market.
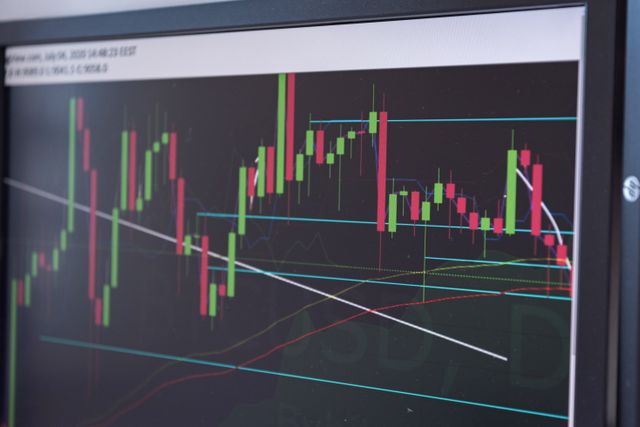
- The Bullish Candle (Green or White): This forms when the Close price is higher than the Open price. It tells you that buyers won the battle during this timeframe, driving prices upward.
- The Bearish Candle (Red or Black): This forms when the Close price is lower than the Open price. It signals that sellers took control, dragging the price downward.
Reading Market Sentiment Through Wicks
The wicks tell a fascinating story about shifting market dynamics.
If you see a candlestick with a very long wick sticking out of the bottom, it means sellers aggressively pushed the price down, but buyers stepped in with immense pressure and forced the price back up before the candle closed. This is often an early clue that a downward trend is losing steam and an upward reversal might be around the corner.
Start Tracking the Charts Live
Reading about candlesticks is a great start, but the patterns only click once you watch them form live on a screen during active trading sessions.
🔗 Get Free Advanced Charting Tools: You do not need to purchase expensive charting software to get started. By registering a practice profile with Exness, you gain access to premium MetaTrader 5 or proprietary charting interfaces completely free, letting you track candlestick setups in real time.